ROC/AUC in Machine Learning
A Receiver Operating Characteristic curve (RUC Curve) is a graphical plot which measures the probability of a classification model at different threshold levels.
The curve is created by plotting the true positive rate or TPR(Which is plotted along the x axis) against the false positive rate or FPR(Which is plotted along the y axis).
AUC stands for Area under the Curve, it is the entire area enclosed by the ROC curve. The closer the area is to 1 , the better is the model.
Uses
- ROC: For identifying the threshold value for which the machine learning model gives the best accuracy.
- AUC: To compare various machine learning algorithms to see which one has a better accuracy.
Defining terms
- True Positive(TP): Outcome where the model correctly predicts the positive class.
- False Negative(FN): Outcome where the model incorrectly predicts the negative class.
- True Positive Rate(TPR): Is the probability where an actual positive will test positive.
- False Positive Rate(FPR): Is the probability where an actual negative will test negative.
- Sensitivity: Measures the proportion of positives which are correctly identified. This is the same as True Positive Rate.
- Specificity: Measures the proportion of negatives which are correctly identified. This is the same as True Negative Rate.


Plotting the curve
In this example, the following machine learning models will be used to demonstrate the use of roc curve:
- Random Forests
- Logistic Regression
- Naïve Bayes
Loading the Breast Cancer dataset from sklearn’s datasets module and storing the data into variables.
For more information about the dataset click here.
Splitting the data into training and testing with 80–20 ratio which means 20% of the dataset will be used for testing and remaining 80% will be used for training.
Importing required libraries and running the machine learning models.
Max features in random forest classifier is set to 3, it can be any value ranging from 0 to n-1 where n is the total number of features. Max iter in logistic regression is set to 3000 after trial and error.
Getting the accuracy of the models using accuracy_score from sklearn’s metrics module.

Now getting the probabilities(whether the output will be 0 or 1), by using the predict_proba function and then slicing the list so that we only end up with the probability that the target variable will be 1.
r_probs is used to plot a diagonal line which covers 50% of the curve or has an AUC value 0.5 , Hence its called random choice because it has a 50% chance of correctly predicting the target variable.
Getting the FPR,TPR and threshold values for each model.
Plotting the curve
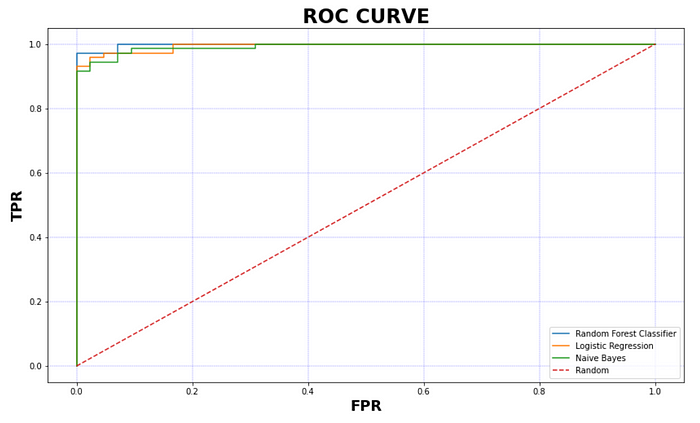
Calculating the AUC score and storing it in a list.
Since in the above code block , the AUC values for each model is stored in a list, plotting it on a bar chart to compare between the different models to choose the best one.

Since Random Forest Classifier has the highest AUC score , to get the best accuracy for this problem , it is preferable to use it over Logistic Regression or Naïve Bayes.
Hence it is more appropriate to use Random Forest Classifier for this problem (out of Random Forest, Logistic Regression and Naïve Bayes)
Application
Using this dataset, to predict the chance of a person having a stroke. Refer to the link above for more information about the dataset.
For more information visit this link which contains the ipynb file. This notebook is focused on a selecting model with the help of ROC curve , it doesn’t explore concepts like feature engineering, however these topics can be combined.
Running the following models on the cleaned data:
- Logistic Regression
- Random Forest Classifier
- Naïve Bayes
Plotting the results using the method explained above.

It is clearly visible that logistic regression has a better accuracy(since it covers the most area under the curve) most of the time except when TPR is in the range 0 to 0.2 , where Naïve Bayes performs the best.
Since Logistic Regression has the highest AUC value, it will give the best accuracy, plotting it separately on a graph.

Selecting the maximum geometric mean(of sensitivity and specificity) to get the maximum threshold for the logistic regression model.
Refer to this link for more information on using Geometric Mean for this purpose.
The Geometric Mean or G-Mean is a metric for imbalanced classification that, if optimized, will seek a balance between the sensitivity and the specificity.

Plotting the point where threshold gives the best accuracy on the graph.


Hence the threshold for which the logistic regression model will give the best accuracy is 0.0348.
Another way to get the best threshold is by using the Youden’s Statistic value or Youden’s Index(denoted by J). Click here for more information.
Conclusion
Using the ROC curve and the AUC value, the most appropriate model for this binary classification problem is a logistic regression model with threshold 0.0348. However the default threshold value for it in sklearn is 0.5, refer to these links to change the default threshold value (or make a logistic regression model from scratch!)
Or refer to this article:
More content at plainenglish.io