Python Profiling
Finding Bottlenecks and Overcoming slow code!
A code is a simple set of instruction to perform an action. It occupies resources like RAM and CPU for its compilation. But a explainable and efficient code occupies less time and resources to complete its execution. There are various techniques and tools to find the performance of the written code.

In this blog post, we’ll introduce the tools, tips and tricks to check the code’s performance and how it can be made efficient with small tweaks.
Profiling
Profiling helps in finding bottlenecks in the code, such that to receive the large practical performance gain. We all naturally believe in running the code faster with reduction in resource usage and practically want our code to be ‘fast enough’ and ‘lean enough’ that fits our requirements. For aforementioned reasons comes profiling, which helps us in making the most pragmatic decisions for the least overall effort.
Tools for profiling
- cProfile (To identify which function takes max time in your code)
- line_profiler (time taken for each line of code in a function)
- py-spy (Keep track of long running processes)
- memory_profiler (Tracking RAM usage over time)
- pstats
- Dis module to examine CPython bytecode.
Tools to measure RAM and CPU consumption
Code Snippet: We’ll test this piece of code for profiling! Feel free to try your code using profiling tools. This piece of code is known as “Julia Set”.
Why this code, because there are multiple function calls and multiple inner loops which makes all the resource in the system busy.
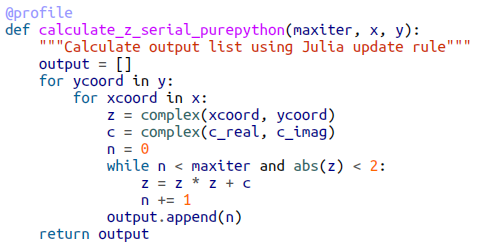
def calculate_z_serial_purepython(maxiter, zs, cs):
    """Calculate output list using Julia update rule"""
    output = [0] * len(zs)
    for i in range(len(zs)):
        n = 0
        z = zs[i]
        c = cs[i]
        while abs(z) < 2 and n < maxiter:
            z = z * z + c
            n += 1
        output[i] = n
    return outputdef calc_pure_python(desired_width, max_iterations):
    """Create a list of complex coordinates (zs) and complex    parameters (cs), build Julia set"""
    x_step = (x2 - x1) / desired_width
    y_step = (y1 - y2) / desired_width
    x = []
    y = []
    ycoord = y2
    while ycoord > y1:
        y.append(ycoord)
        ycoord += y_step
    xcoord = x1
    while xcoord < x2:
        x.append(xcoord)
        xcoord += x_step
    #build a list of coordinates and the initial condition for each cell.
    #Note that our initial condition is a constant and could easily be removed,
    #we use it to simulate a real-world scenario with several inputs to our
    # function
    zs = []
    cs = []
    for ycoord in y:
        for xcoord in x:
            zs.append(complex(xcoord, ycoord))
            cs.append(complex(c_real, c_imag))    print("Length of x:", len(x))
    print("Total elements:", len(zs))
    start_time = time.time()
    output = calculate_z_serial_purepython(max_iterations, zs, cs)
    end_time = time.time()
    secs = end_time - start_time
    print(calculate_z_serial_purepython.__name__ + " took", secs, "seconds")
    # This sum is expected for a 1000^2 grid with 300 iterations
    # It ensures that our code evolves exactly as we'd intended
    assert sum(output) == 33219980calc_pure_python(desired_width=1000, max_iterations=300)
cProfile
It is a built-in profiling tool in the standard library. It hooks into the virtual machine in CPython to measure the time taken to run every function that it sees. This introduces a greater overhead, but you get correspondingly more information. Sometimes the additional information can lead to surprising insights into your code.
cProfile is one of two profilers in the standard library, alongside profile. profile is the original and slower pure Python profiler; cProfile has the same interface as profile and is written in C for a lower overhead.
Snakeviz is a visualizer that draws the output of cProfile as a diagram in which larger boxes are areas of code that take longer to run. It replaces the older runsnake tool.

From above image, it can be noted, what is the time taken for each function. Sorting by cumulative time gives us an idea about where the majority of execution time is spent. This result shows us that 36,221,995 function calls occurred in just over 12 seconds (this time includes the overhead of using cProfile).
Function call to calc_pure_python takes 1 second and function call to calculate _z_serial_purepython takes 11 seconds, these two functions are called only once.
the call to calculate_z_serial_purepython function is CPU-intensive, since the manipulation happens inside this function. However, we can’t derive which lines take the time inside the function using cProfile.

The above visualization represents the time taken for each function to execute.
line_profiler
cProfile acts as a guide to identify which functions is costly in terms of execution time, while the line_profiler acts on top of each function, to identify, which line takes max amount of time for execution. line_profiler helps in finding the CPU usage.

The % Time column is the most helpful — we can see that 38% of the time is spent on the while testing. We don’t know whether the first statement (abs(z) < 2) is more expensive than the second (n < maxiter), though. Inside the loop, we see that the update to z is also fairly expensive. Even n += 1 is expensive! Python’s dynamic lookup machinery is at work for every loop, even though we’re using the same types for each variable in each loop — this is where compiling and type specialization give us a massive win. The creation of the output list and the updates on line 20 are relatively cheap compared to the cost of the while loop.
memory_profiler
memory_profiler finds the amount of memory (RAM) being used on line to line basis. memory_profiler helps in answering two question
- Can a function be rewritten efficiently such that it takes less RAM?
- Can we use more RAM and save the CPU cycle by caching?
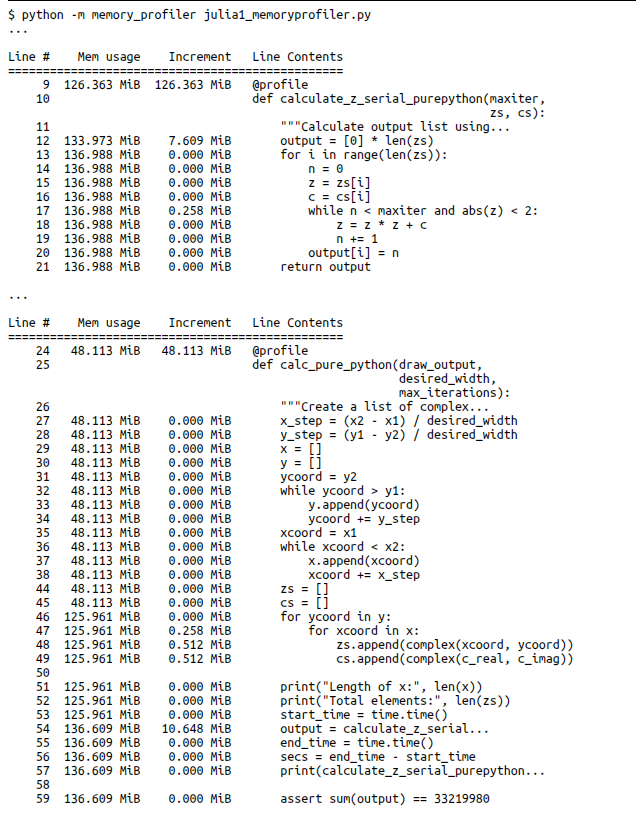
From the above image, check line no. 12, the amount of memory added to the process is 7MB i.e. the output variable increases the occupancy of RAM by 7MB.
Similarly in parent function, ‘calc_pure_python’ at line 46, the memory is increased from 48MB to 126MB, which is the result of bringing in two list zs and cs, irrespective of these true array size, process size grew when list was created.
To reduce the RAM usage, we can perform runtime calculation of z_serial instead creating a separate list for zs and cs, and then passing that as parameter to calculate_z_serial_purepython.
Find the below snippet
After making the following changes, the amount of RAM utilized is reduced from 140MB to 60MB.
Py-spy
py-spy is an intriguing new sampling profiler — rather than requiring any code changes, it introspects an already-running Python process. Being a sampling profiler, it has almost no runtime impact on the code. It is written in Rust and requires elevated privileges to introspect another process.
This tool could be very useful in a production environment with long-running processes or complicated installation requirements.
Since it works on existing running python process, we need mention the pid (process id) of the process on which we intend to spy on.
$ ps -A -o pid,rss,cmd | ack python15953 96156 python julia1_nopil.py$ sudo env "PATH=$PATH" py-spy --pid 15953

We can utilize plots like flame chart to represent the time taken by the code. The width represents the total time taken for the program to run.

Under the Hood — Bytecode
Bytecode helps in understanding the slow function of the code, while we are compiling it. A tool to understand the bytecode is dis module, it examines the CPython Bytecode.
dis Module
The dis module lets us inspect the underlying bytecode that we run inside the stack-based CPython virtual machine. Having an understanding of what’s happening in the virtual machine that runs your higher-level Python code will help us in understanding why some styles of coding are faster than others. It will also help when we come to use a tool like Cython, which steps outside of Python and generates C code.
Consider two version of a program, To find a Sum of N number, N=1000000.
def fn_expressive(upper=1000000):
    total = 0
    for n in range(upper):
        total += n
    return totaldef fn_terse(upper=1000000):
    return sum(range(upper))In [2]: %timeit fn_expressive()
52.4 ms ± 86.4 µs per loop (mean ± std. dev. of 7 runs, 10 loops each)In [3]: %timeit fn_terse()
18.1 ms ± 1.38 ms per loop (mean ± std. dev. of 7 runs, 100 loops each)
Bytecode version of the functions
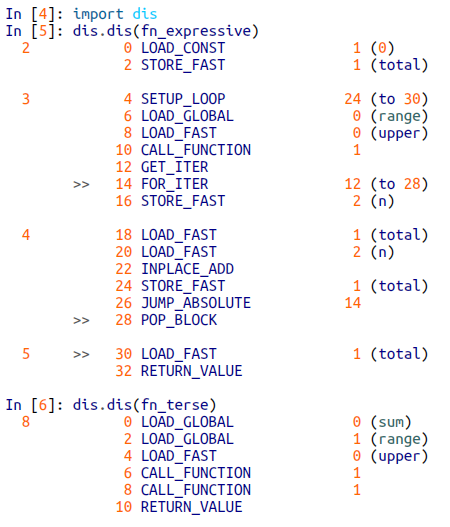
The number of bytecode lines generated for fn_expressive is 17 and for fn_terse is 6 lines. The fn_expressive maintains two variables and a loop which checks the type of variable during addition on each iteration which makes the operation expensive compared to fn_terse, which is a optimized C list comprehension, it generates results without any python object in between.
Decreasing the lines of code, automatically reduces the number of bytecodes generated, causing the time taken for execution to reduce drastically.
I hope, you liked reading this article.
References
High Performance Python by Micha Gorelick, Ian Ozsvald
Connect with me for more articles: