Python Libraries Every Developer Should Know
Discover the Power of Essential Python Libraries — NumPy, Pandas, Matplotlib, and Scikit-learn — and Unleash Their Key Functionalities and Use Cases
Introduction
Python, with its vast ecosystem of libraries, offers developers a treasure trove of powerful tools to streamline their development process. In this article, we will explore some essential Python libraries that every developer should be familiar with. We will dive into the functionalities and use cases of NumPy, Pandas, Matplotlib, and Scikit-learn, showcasing their importance in various domains and providing code snippets to demonstrate their capabilities.
Disclaimer: This article was generated with the assistance of ChatGPT, an AI language model. The code snippets provided are for illustrative purposes and may require additional modifications and considerations for real-world implementation.

NumPy: Numerical Computing with Python
NumPy, short for Numerical Python, is a fundamental library for scientific computing in Python. It provides support for large, multi-dimensional arrays and matrices, along with a collection of mathematical functions to manipulate and analyze these arrays efficiently.
Key Functionalities of NumPy:
- Multi-dimensional Arrays: NumPy’s
ndarrayobject enables efficient storage and manipulation of large multi-dimensional arrays, which are the building blocks for many scientific computing tasks.
import numpy as np

# Create a 1-dimensional NumPy array
arr = np.array([1, 2, 3, 4, 5])

# Create a 2-dimensional NumPy array
matrix = np.array([[1, 2, 3], [4, 5, 6], [7, 8, 9]])- Mathematical Operations: NumPy provides a wide range of mathematical functions, such as trigonometric, logarithmic, and statistical operations, which can be applied to arrays element-wise or along specific axes.
import numpy as np

arr = np.array([1, 2, 3, 4, 5])

# Calculate the mean of the array
mean = np.mean(arr)

# Calculate the sine of each element in the array
sin_arr = np.sin(arr)- Broadcasting: NumPy’s broadcasting feature allows for arithmetic operations between arrays of different shapes, enabling efficient computation on arrays without the need for explicit looping.
import numpy as np

arr = np.array([1, 2, 3, 4, 5])

# Add a scalar to each element of the array using broadcasting
result = arr + 10
Pandas: Data Manipulation and Analysis
Pandas is a powerful library for data manipulation and analysis in Python. It provides easy-to-use data structures and data analysis tools, making it a valuable asset for tasks like data cleaning, exploration, and transformation.
Key Functionalities of Pandas:
- DataFrame: The core component of Pandas, the
DataFrame, is a two-dimensional table that can hold heterogeneous data. It allows for easy indexing, slicing, and filtering of data, making it ideal for data wrangling tasks.
import pandas as pd

# Create a DataFrame from a dictionary
data = {'Name': ['John', 'Jane', 'Sam'],
        'Age': [25, 30, 28],
        'City': ['New York', 'London', 'Tokyo']}
df = pd.DataFrame(data)- Data Manipulation: Pandas provides various functions for data manipulation, such as sorting, merging, grouping, and aggregating data. These operations help in transforming and summarizing large datasets efficiently.
import pandas as pd

# Sort the DataFrame by Age in descending order
sorted_df = df.sort_values('Age', ascending=False)

# Group the DataFrame by City and calculate the mean age
grouped_df = df.groupby('City')['Age'].mean()- Data Visualization: Pandas seamlessly integrates with other visualization libraries like Matplotlib, allowing developers to create insightful plots and charts from their data.
import pandas as pd
import matplotlib.pyplot as plt

# Plot a bar chart of age distribution
df['Age'].plot(kind='bar')

# Display the plot
plt.show()
Matplotlib: Data Visualization
Matplotlib is a versatile library for creating visualizations in Python. It provides a wide range of plotting options, allowing developers to generate high-quality charts, graphs, histograms, and more.
Key Functionalities of Matplotlib:
- Line Plots: Matplotlib can create simple line plots, making it easy to visualize trends and patterns in data.
import pandas as pd
import matplotlib.pyplot as plt

# Plot a bar chart of age distribution
df['Age'].plot(kind='bar')

# Display the plot
plt.show()- Scatter Plots: Matplotlib allows for the creation of scatter plots, helpful for visualizing the relationship between two variables.
import matplotlib.pyplot as plt

# Create data for x and y coordinates
x = [1, 2, 3, 4, 5]
y = [1, 4, 9, 16, 25]

# Plot the scatter chart
plt.scatter(x, y)

# Display the plot
plt.show()p- Histograms: Matplotlib enables the creation of histograms, aiding in visualizing the distribution of data.
import matplotlib.pyplot as plt

# Create data for a histogram
data = [1, 1, 1, 2, 2, 3, 4, 5, 5, 6]

# Plot the histogram
plt.hist(data)

# Dplay the plot
plt.show()
Scikit-learn: Machine Learning Made Easy
Scikit-learn is a powerful machine learning library in Python, providing a wide range of tools for tasks such as classification, regression, clustering, and dimensionality reduction.
Key Functionalities of Scikit-learn:
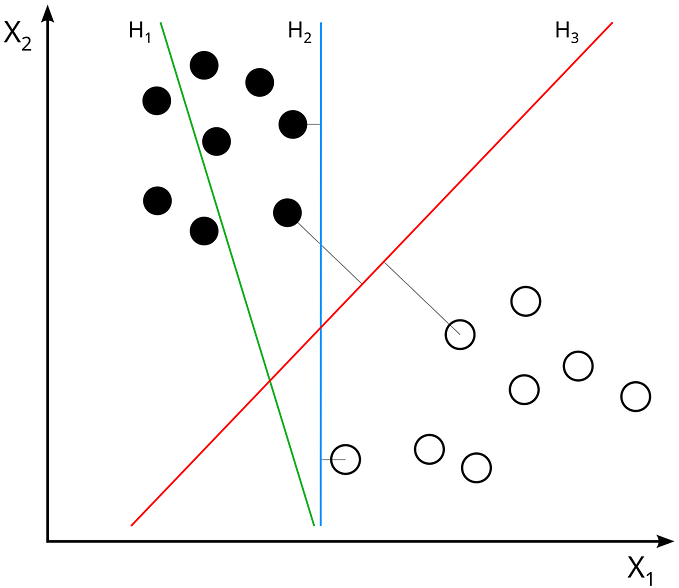
- Supervised Learning: Scikit-learn offers numerous algorithms for supervised learning, including decision trees, support vector machines (SVM), random forests, and neural networks. These algorithms allow developers to build models for tasks like classification and regression.
from sklearn.ensemble import RandomForestClassifier

# Create a Random Forest Classifier
clf = RandomForestClassifier()

# Fit the model to the training data
clf.fit(X_train, y_train)

# Predict the labels for new data
predictions = clf.predict(X_test)
from sklearn.ensemble import RandomForestClassifier # Create a Random Forest Classifier clf = RandomForestClassifier() # Fit the model to the training data clf.fit(X_train, y_train) # Predict the labels for new data predictions = clf.predict(X_test)- Unsupervised Learning: Scikit-learn provides algorithms for unsupervised learning, such as clustering and dimensionality reduction. These techniques help uncover patterns, group similar data points, and reduce the dimensionality of complex datasets.
from sklearn.cluster import KMeans

# Create a K-Means clustering model
kmeans = KMeans(n_clusters=3)

# Fit the model to the data
kmeans.fit(X)

# Get the cluster labels for each data point
labels = kmeans.labels_- Model Evaluation and Selection: Scikit-learn offers tools for evaluating the performance of machine learning models, such as accuracy, precision, recall, and F1-score. It also provides techniques for model selection, including cross-validation and hyperparameter tuning.
from sklearn.model_selection import cross_val_score
from sklearn.metrics import accuracy_score

# Perform cross-validation on a model
scores = cross_val_score(model, X, y, cv=5)

# Calculate the mean accuracy
mean_accuracy = scores.mean()

# Evaluate the model on a test set
predictions = model.predict(X_test)
accuracy = accuracy_score(y_test, predictions)
Conclusion
These essential Python libraries, NumPy, Pandas, Matplotlib, and Scikit-learn, play a crucial role in the development process of many projects. By leveraging the functionalities provided by these libraries, developers can handle numerical computations, data manipulation, visualization, and machine learning tasks efficiently. Incorporating these libraries into your Python projects will significantly enhance your productivity and enable you to build robust and data-driven applications.
Additional Resources:
- NumPy Official Website: numpy.org
- Pandas Official Website: pandas.pydata.org
- Matplotlib Official Website: matplotlib.org
- Scikit-learn Official Website: scikit-learn.org
- NumPy User Guide: numpy.org/doc
- Pandas User Guide: pandas.pydata.org/docs
- Matplotlib Tutorials: matplotlib.org/stable/tutorials
- Scikit-learn Tutorials: scikit-learn.org/stable/tutorial
More content at PlainEnglish.io.
Sign up for our free weekly newsletter. Follow us on Twitter, LinkedIn, YouTube, and Discord.


